Immigration to Northampton (1880-1920)
Introduction
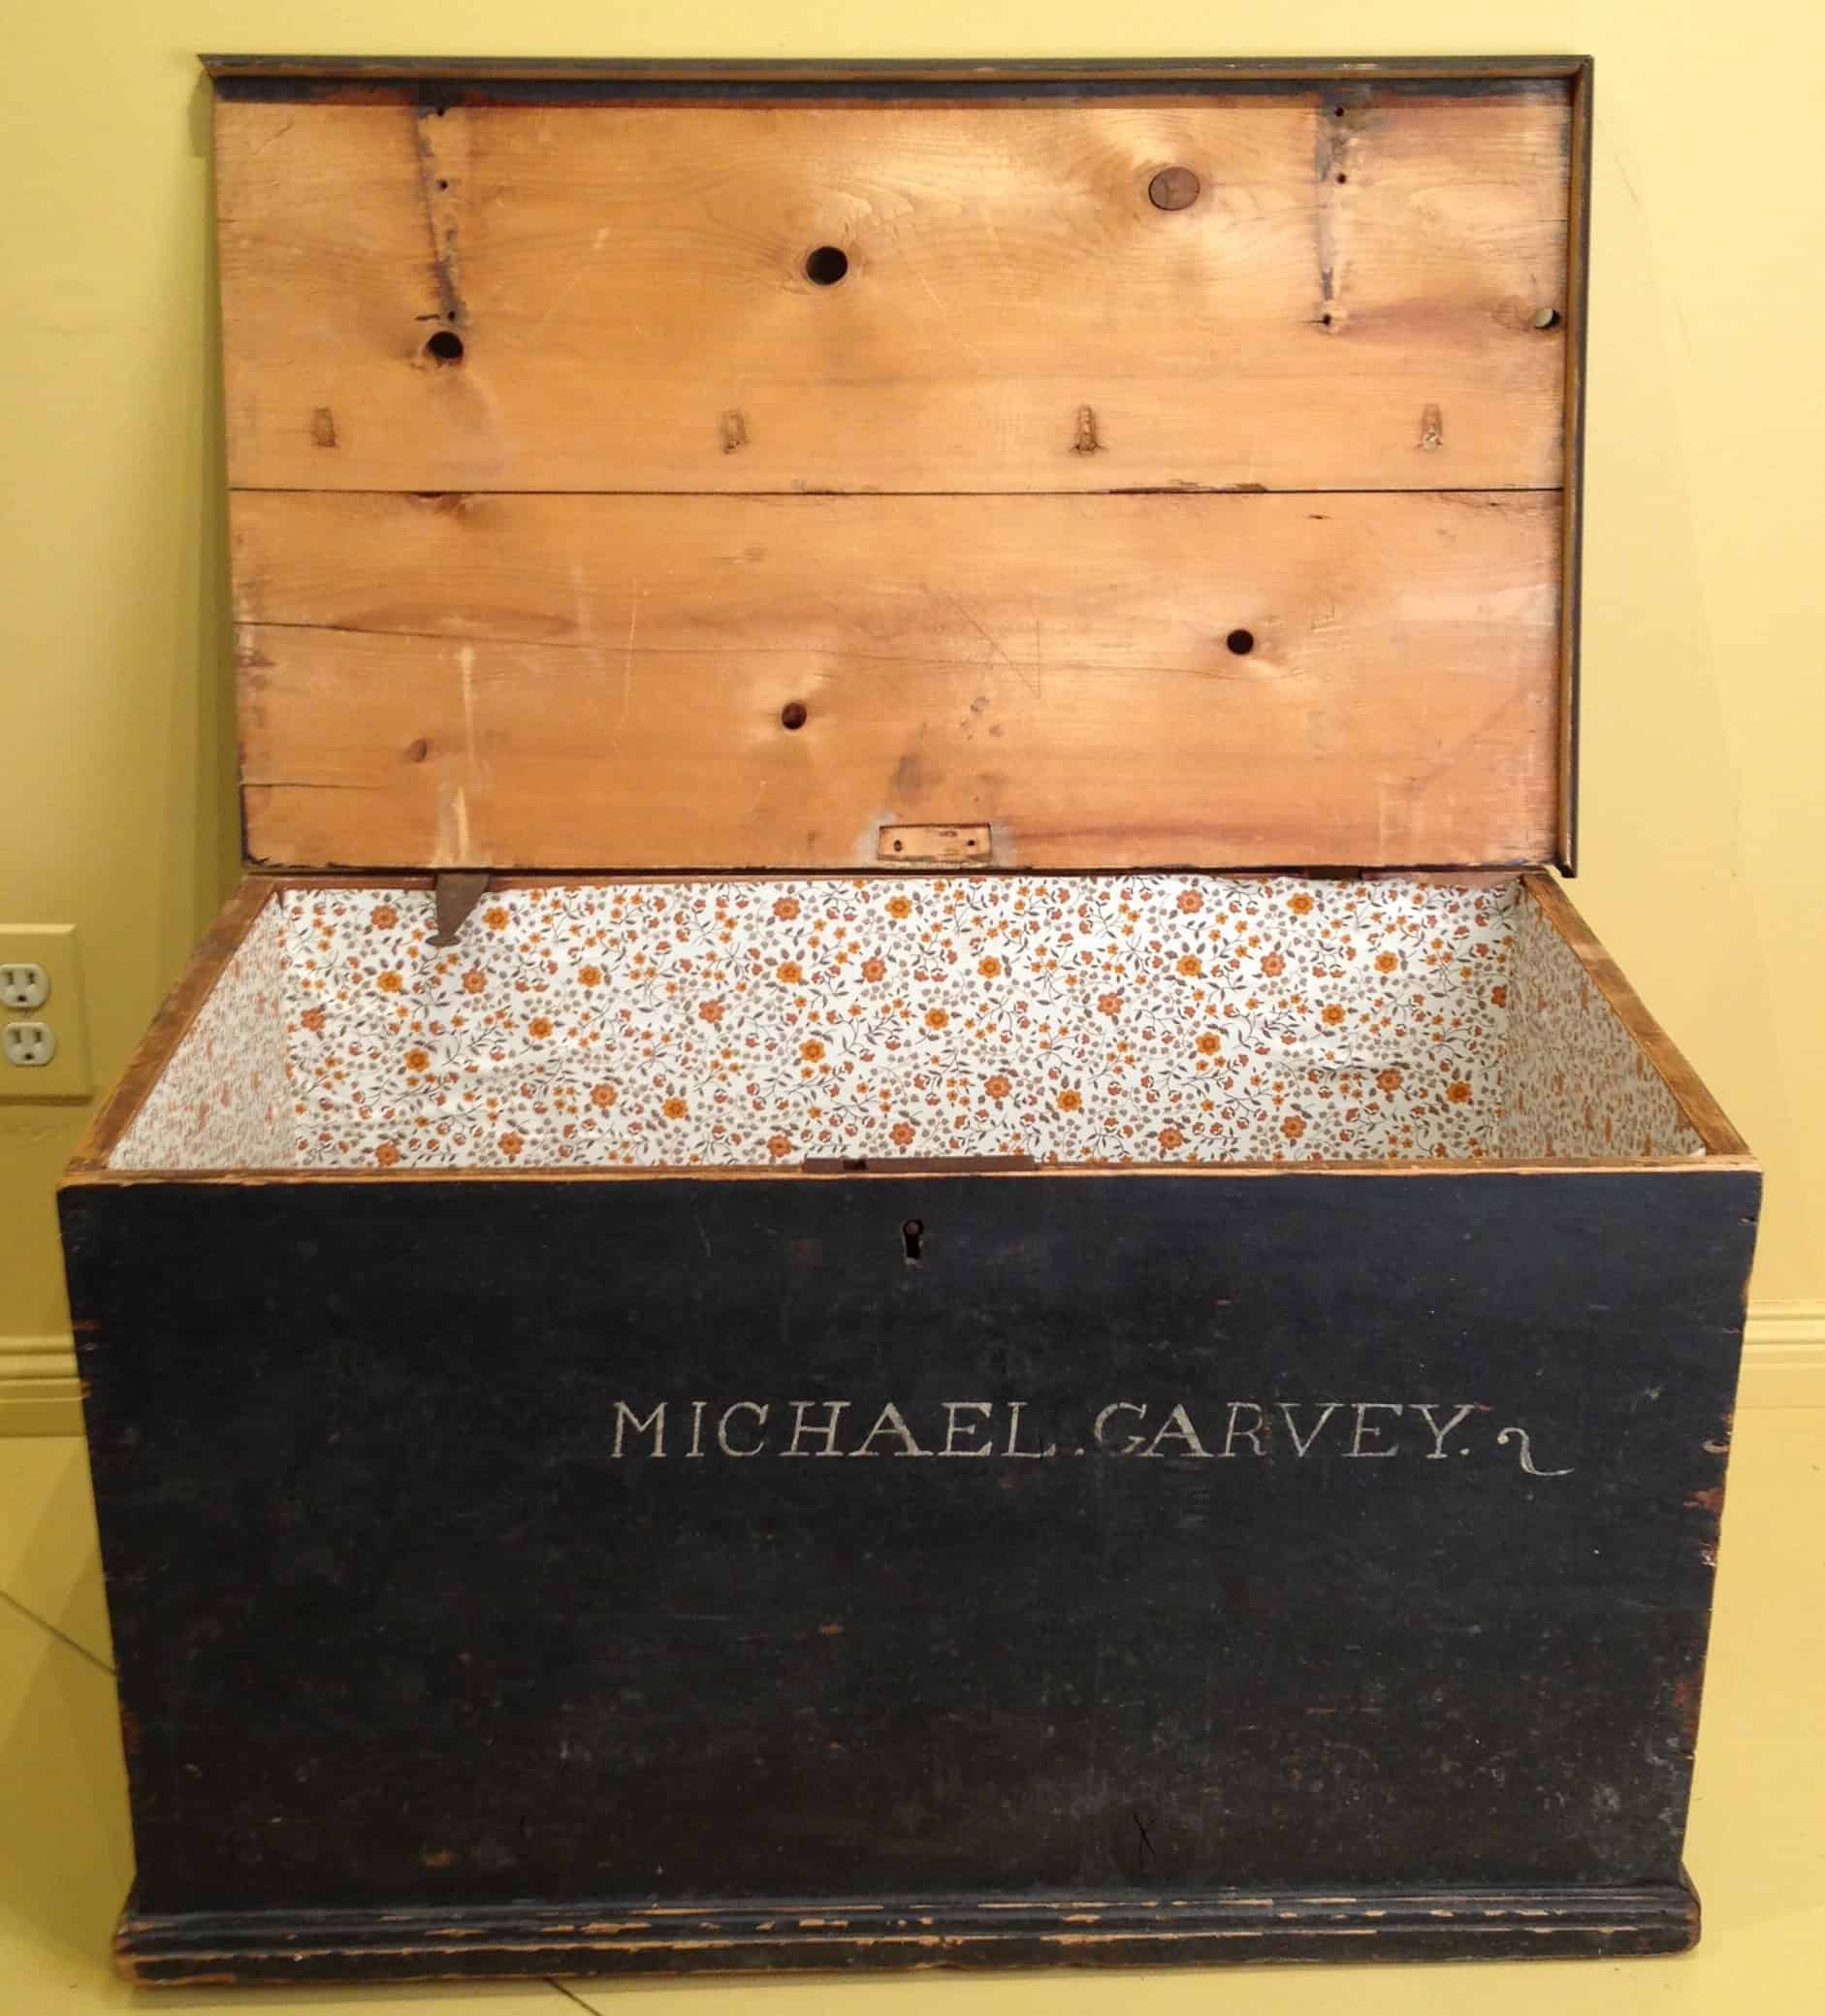
Between 1880 and 1920, Northampton’s population grew by 82%. Much of the increase was due to a rising immigrant population. By 1920 a total of 38% of the population was first or second generation immigrants.
A Wave of Immigration
Between 1880 and 1920, the population of Northampton grew, in part, to accommodate arrivals from foreign countries. According to U.S. Census records, the city population rose from 11,965 (in 1880) to 18,554 (in 1900), to 21,761 (in 1920). During this period, the percentage of first- or second-generation immigrants living in Northampton increased substantially. In 1880, 24.51% of Northampton residents were first- or second-generation immigrants, and by 1920, this percentage was 37.55%.
Northampton, Massachusetts, total population according to the U.S. Census and % increase
| 1880 | 11,965 | |
| 1900 | 18,554 | 55% |
| 1920 | 21,761 | 17% |
Who Came to Northampton?
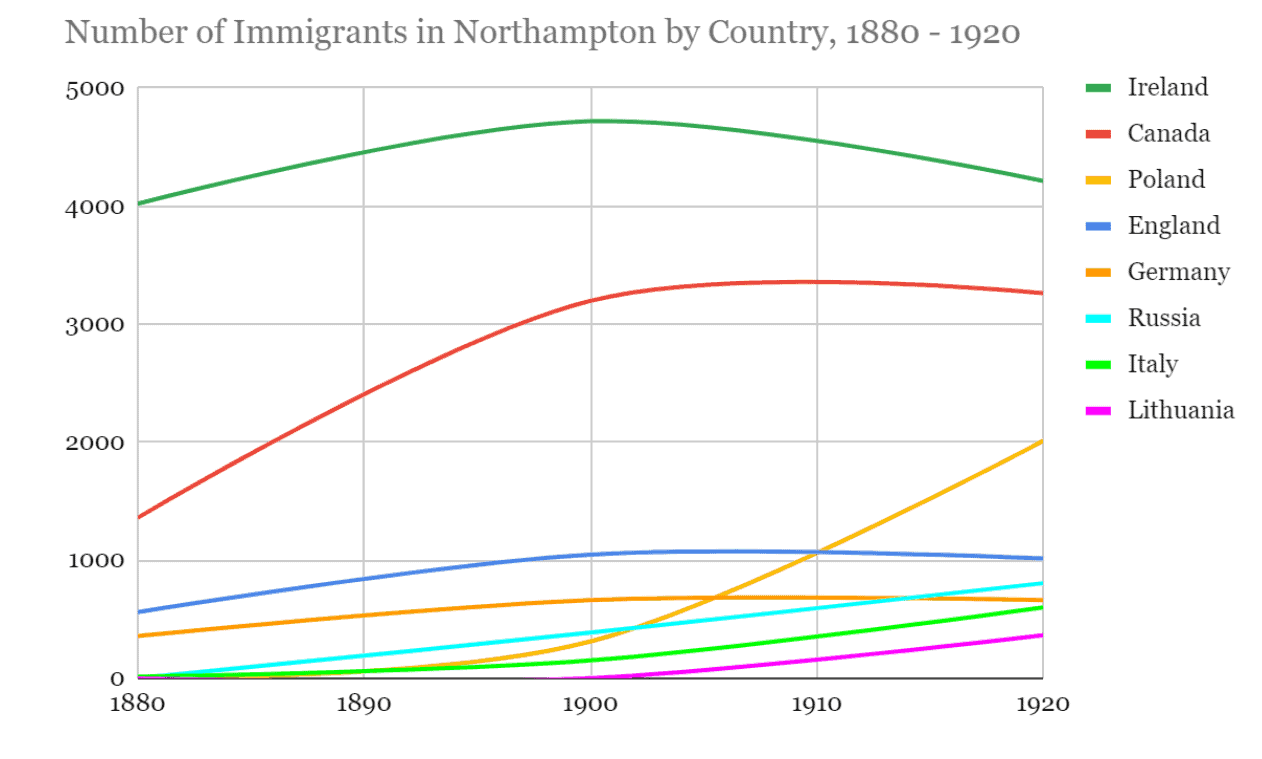
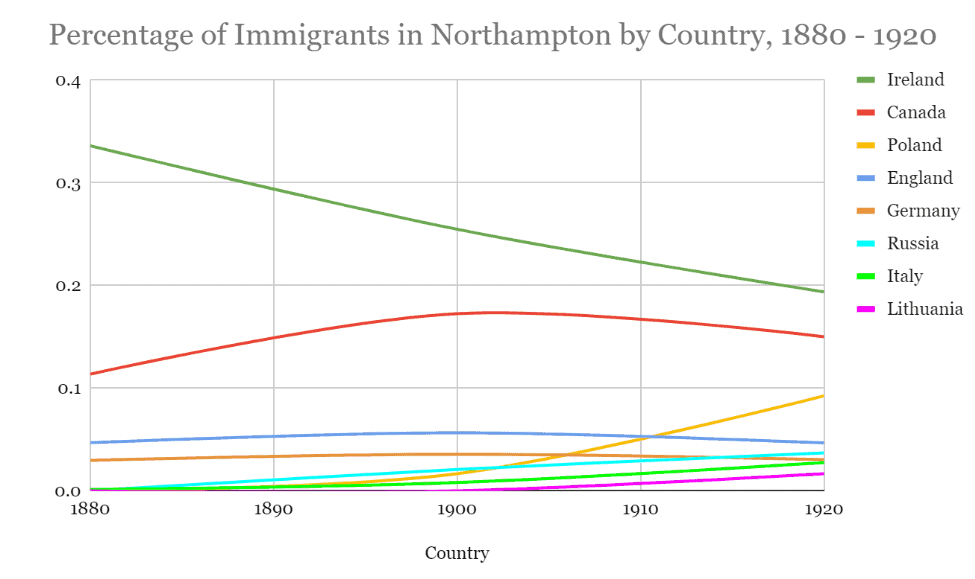
The following statistics represented in graphs and tables were calculated from census records for the years 1880, 1900, and 1920 in Northampton, Massachusetts. It is well established by immigration historians that census recorders regularly undercount low-income and/or non-native populations for various reasons including language barriers, inadequate knowledge of the community, and discrimination. These statistics can, however, offer a broad idea of who came to Northampton and when.
Countries of Origin
From these census records, it is clear that the Irish community in Northampton began to grow in the 1840s and was well-established by 1880. It grew continually until 1900. Immigration from Canada took off a few decades later than immigration from Ireland, rising sharply between 1880 and 1900. Polish individuals and families came to Northampton in greater numbers between the years 1900 and 1920.
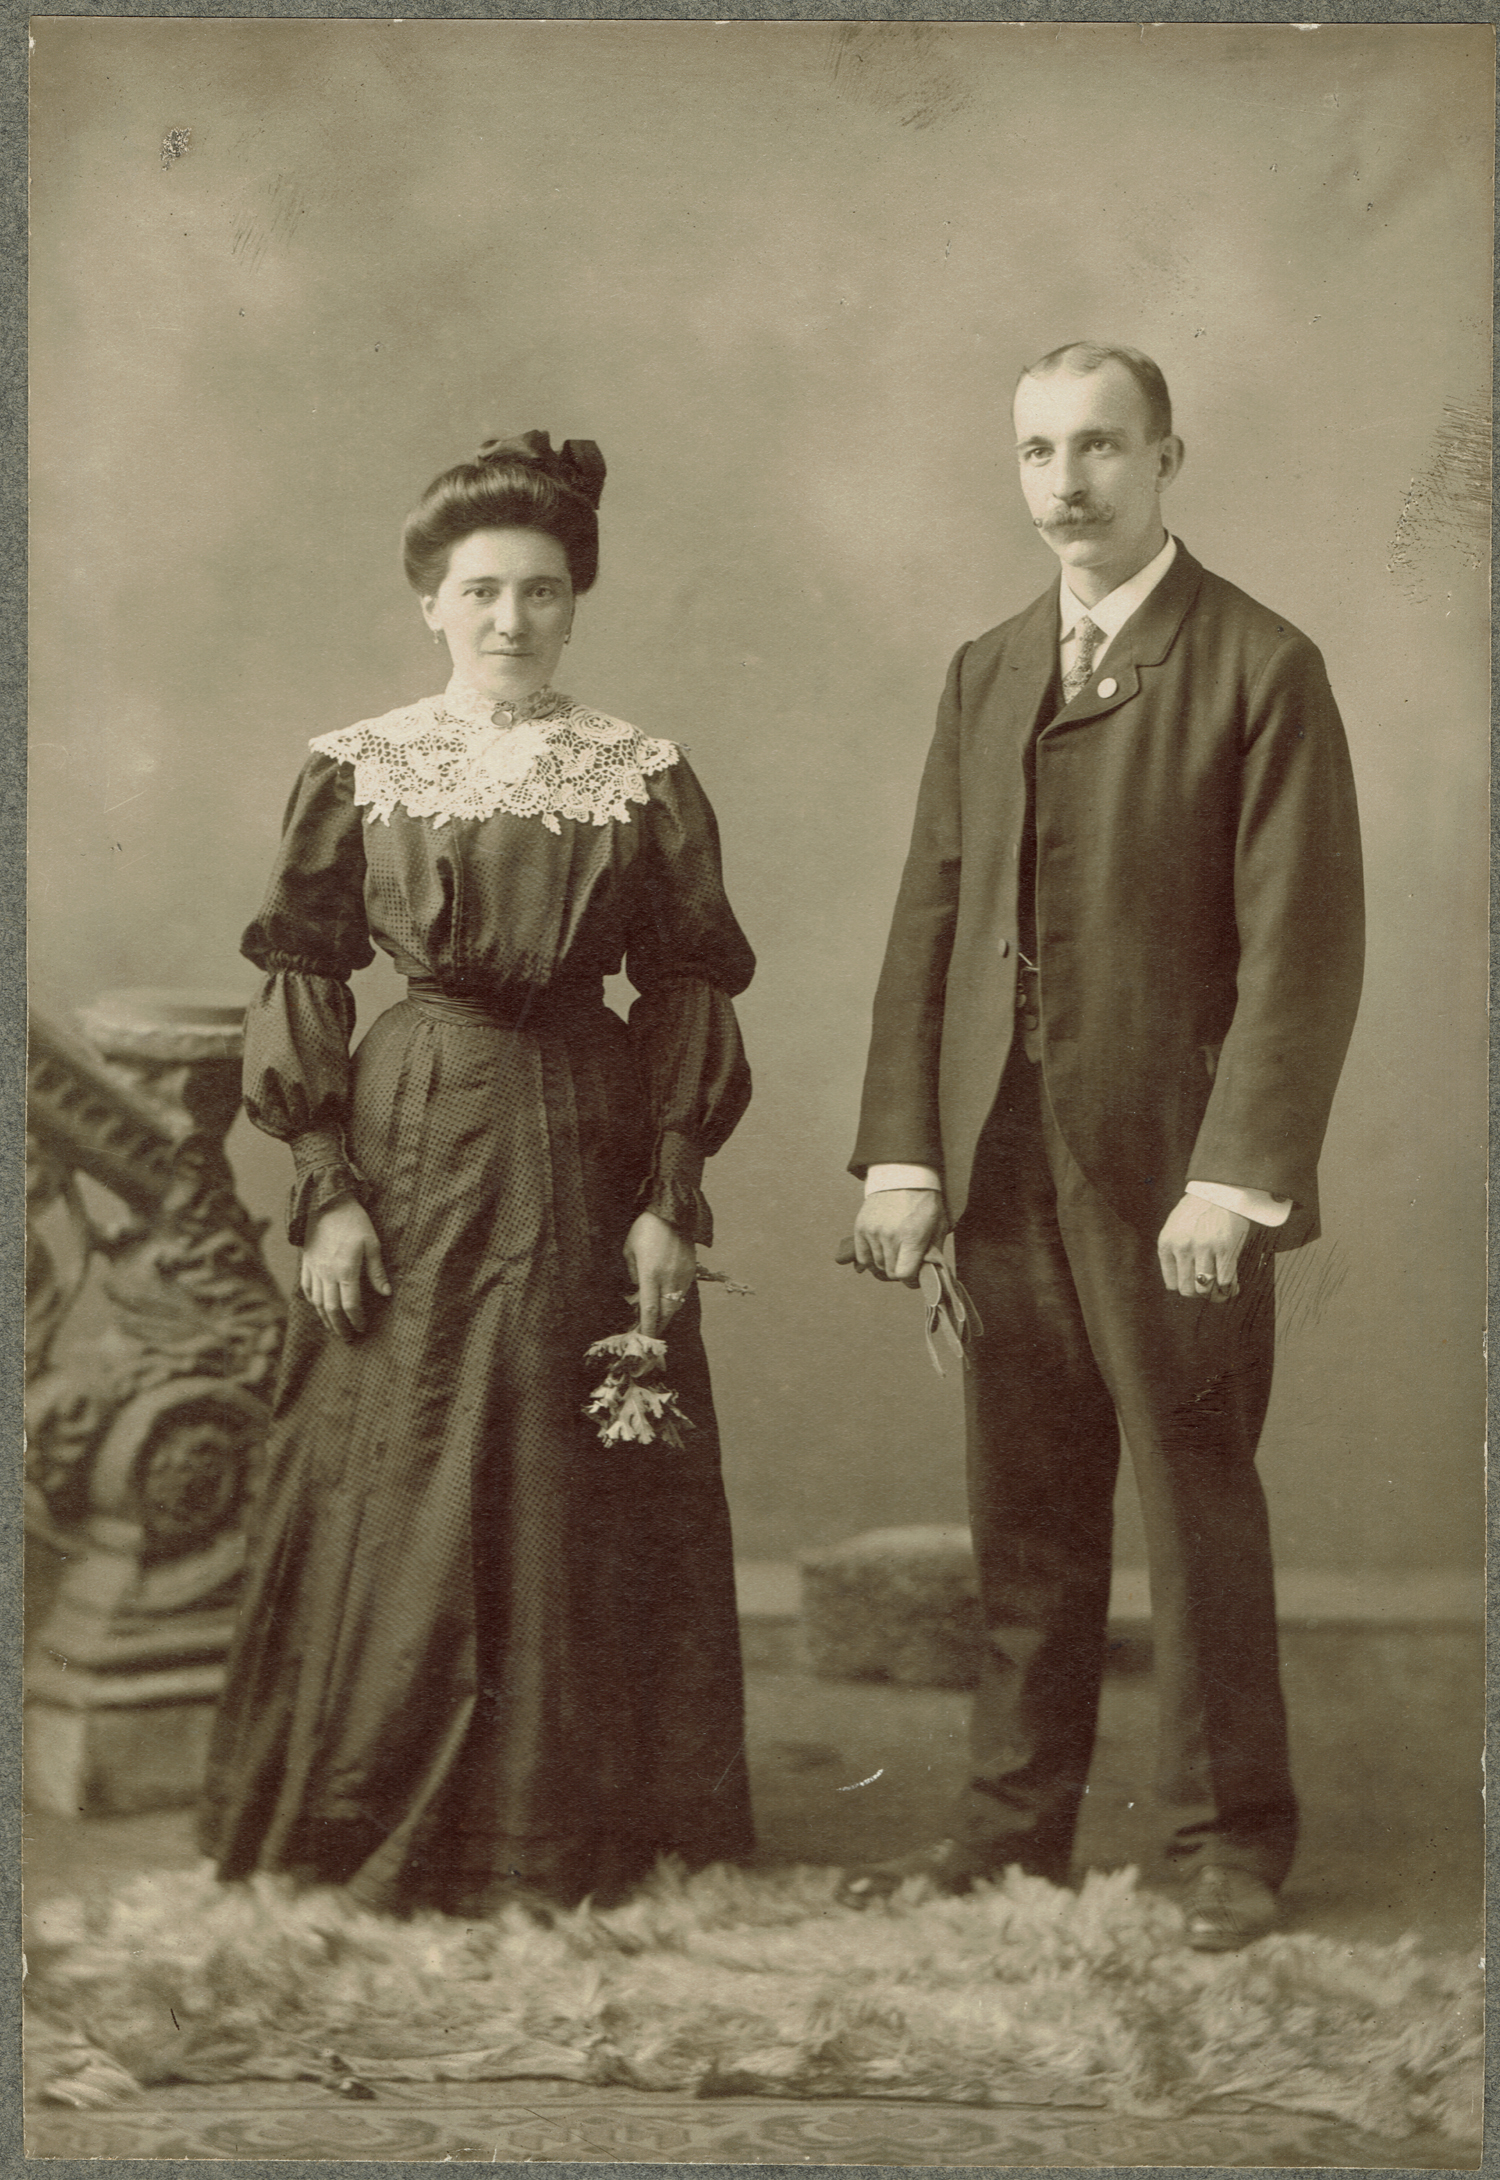
According to records in Historic Northampton’s oral history collection, most Polish immigrants chose to settle in the neighboring towns of Hatfield and Hadley. As such, the number of Polish people residing in Northampton can be considered an underrepresentation of the Polish community in Hampshire County at large.
Over time, the top countries of origin represented in Northampton were Ireland, Canada, Poland, England, Germany, Russia, Italy, Lithuania, Scotland, and Austria. Immigrants came to Northampton from over 50 countries and territories including, in small numbers, those from Albania, Argentina, Armenia, Australia, Bohemia, Chile, China, Cuba, Greece, India, Jamaica, Japan, Mexico, South Africa, Syria, Sweden, Turkey, the West Indies, and Venezuela.
| Country of Origin: | # of People: | % of Population: |
| Canada – 1880 | 1359 | 11.36% |
| Canada – 1900 | 3197 | 17.25% |
| Canada – 1920 | 3262 | 15.00% |
| Ireland – 1880 | 4019 | 33.59% |
| Ireland – 1900 | 4718 | 25.46% |
| Ireland – 1920 | 4213 | 19.37% |
| Poland – 1880 | 6 | 0.05% |
| Poland – 1900 | 312 | 1.68% |
| Poland – 1920 | 2012 | 9.25% |
| England – 1880 | 561 | 4.69% |
| England – 1900 | 1048 | 5.66% |
| England – 1920 | 1015 | 4.67% |
| Germany – 1880 | 358 | 2.98% |
| Germany – 1900 | 662 | 3.57% |
| Germany – 1920 | 663 | 3.05% |
| Russia – 1880 | 2 | 0.02% |
| Russia – 1900 | 387 | 2.09% |
| Russia – 1920 | 806 | 3.71% |
| Italy – 1880 | 14 | 0.14% |
| Italy – 1900 | 152 | 0.82% |
| Italy – 1920 | 600 | 2.76% |
| Lithuania – 1880 | 0 | 0% |
| Lithuania – 1900 | 2 | 0.01% |
| Lithuania – 1920 | 366 | 1.68% |
| Scotland – 1880 | 106 | 0.89% |
| Scotland – 1900 | 282 | 1.52% |
| Scotland – 1920 | 289 | 1.33% |
| Austria – 1880 | 2 | 0.02% |
| Austria – 1900 | 71 | 0.38% |
| Austria – 1920 | 305 | 1.40% |
Resources
Wayne E. Phaneuf and Joseph Carvalho III, Polish Heritage: A History of a Proud Community in Western Massachusetts. The Springfield Republican, 2017.
Historic Northampton Oral History Collection. Three examples: Alba Fiorentino discusses her parents’ emigration from Italy, (1979.32.1); Laure Dragon describes the French enclave (1976.152); Jack August discusses Jewish immigration (1976.107).